Нет товаров
Товар добавлен в корзину
Товаров в корзине: 0. Сейчас в корзине 1 товар.
 Увеличить
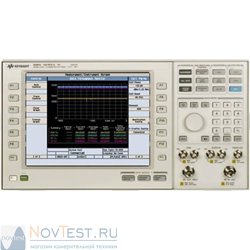
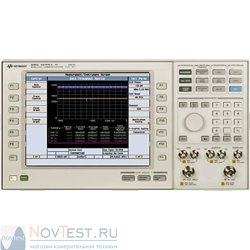
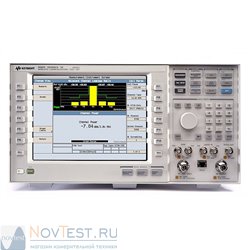
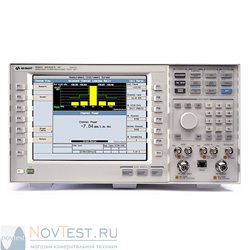
N4017A
N4017A

N4017A Bluetooth® Graphical Measurement Application
- Убрать этот товар из моего избранного.
- Добавить этот товар в избранное.
- Печать
Описание - N4017A
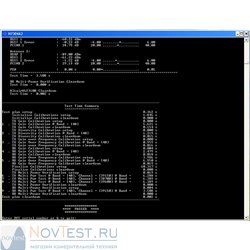
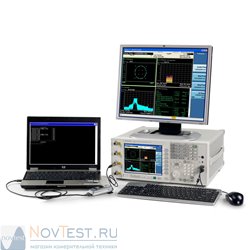
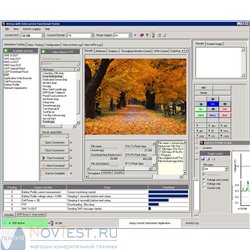
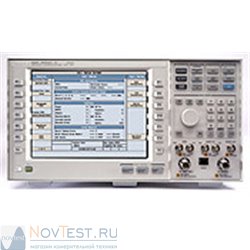
The N4017A Bluetooth® Graphical Measurement Application, a PC-based software tool works in a complementary manner with the N4010A Wireless Connectivity Test Set, and providing the ability to fully configure the test set and display both numerical and graphical results. This capability makes the N4017A an ideal development tool for R&D engineers and a well-designed debug tool for manufacturing test engineers.
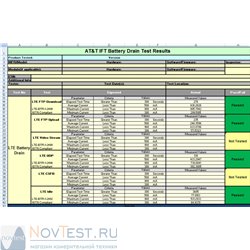
BT v1.1 and 1.2 measurements - Average power, peak power, ICFT, carrier freq drift, carrier freq drift rate, delta F1 average, delta F2 maximum, delta F2 averages, delta F2/delta F1 ratio, bit error rate and packet error rate
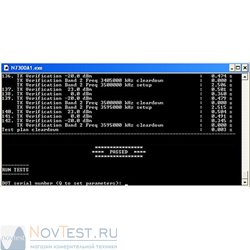
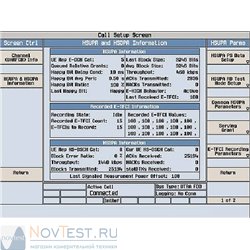
BT v2.0+EDR measurements (Option 205) - EDR relative power, EDR carrier frequency stability and modulation accuracy, EDR differential phase encoding, EDR guard interval, EDR sensitivity, EDR BER floor performance, EDR maximum input level
Audio measurements (when N4010A Option 113 is present) – SINAD, distortion, frequency, and level
Bluetooth and the Bluetooth logos are trademarks owned by Bluetooth SIG, Inc., U.S.A. and licensed to Keysight Technologies, Inc.
- Operates in four different modes: Analyzer, Generator, Test Mode, and both ACL and SCO Normal Mode (with swept measurements using a test mode connectiona and audio analysis using ACL and SCO Normal Mode)
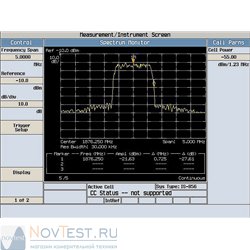
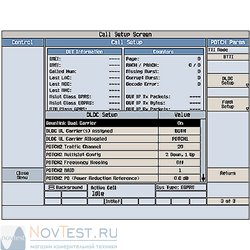
- Provides PC control of N4010A in RF analyzer and generator modes for CW and BT signals
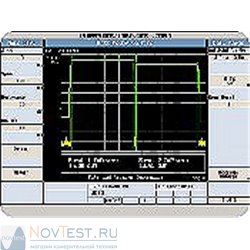
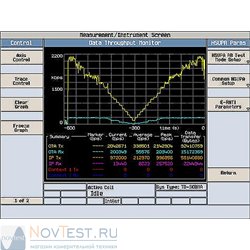
- Enables swept measurements including BER vs channel, and power vs channel
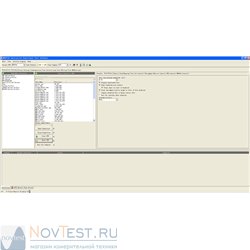
- Provides graphical views of power vs time, demod vs time, and IQ including zoom capabilities
- Set audio tone parameters and perform audio measurements such as SINAD, distortion, frequency, and level (when N4010A Option 113 is present)
- Numerical view with detailed results
- Export of text-based reports with setup and results data. Ability to save graphs or copy of them into other packages
- Provides the ability to capture IQ data from the EUT and save it as a waveform or a .csv file